
Think about the last time you went searching for specific information on the public service. Maybe you were writing a report and needed statistics on the make-up of the workforce or the experiences of public servants, for example. Well now you can have the complete picture.
Recently, TBS improved access to data in a way that provides richer data and deeper analysis. More specifically, through the new Data Visualization Tool.
This interactive tool takes the collection, analysis, and availability of data further than before by allowing users to customize and manipulate fields and parameters to easily access and visualize human resources employment equity and demographic data. It was formally launched in April, but the foundation was laid months earlier.
Last fall saw multiple and ongoing releases of disaggregated data, with employment equity data having been made publicly available for the first time for all 21 sub‑groups under the four employment equity groups in the Employment Equity Act (Indigenous peoples, women, members of visible minorities and persons with disabilities).
We recently caught up with Julian Taylor, Director of Workforce Data and Analytics Services, who shared a bit more about this approach. “Over the last year, we’ve increased our focus on the self-service approach to our dissemination of data.” This self-service approach allowed disaggregated data to be drawn from employees who voluntarily chose to self-identify. It began to paint a more complete picture of the composition and experiences of these groups in the public service as a result.
The public service has become more and more representative of Canada’s population over the years, but there are still gaps. The Data Visualization Tool helps make those gaps known and allows us to improve representation even more. As Julian says, “This understanding of the workforce from many different angles is critical to being able to manage changes as we move into the future. Any time we can put out information that provides a realistic picture of the workforce, I am very happy to see that.”
So, if you want to start accessing and using this information, where do you start?
We get that not everyone reviews data in the same way. Some of us are very hands on and prefer an interactive experience. If so, our Data Visualization Tool is a great way for you to review and manipulate data. While including representation for the four employment equity groups and 21 sub‑groups mentioned earlier, the tool also showcases employment trends and demographics for the core public administration. You can also filter, visualize, and export customized data charts and tables right from the tool, which is a handy feature.
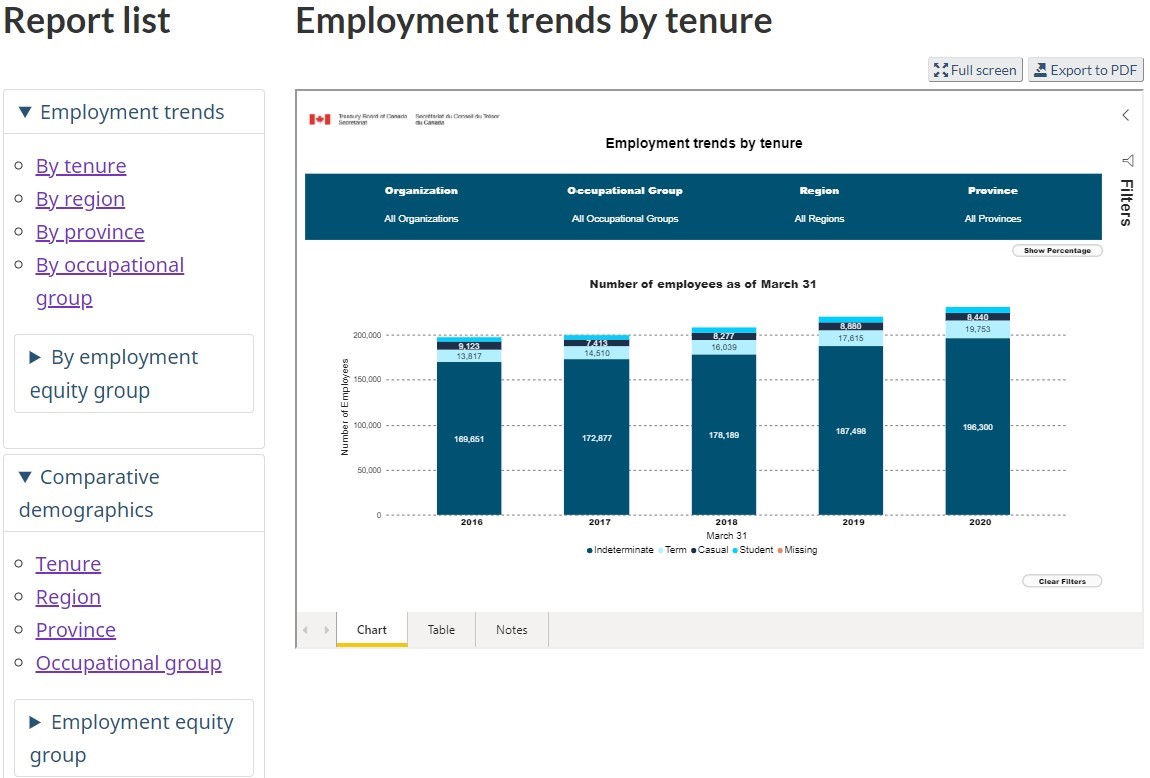
Text version
Screenshot of the Data Visualization Tool taken from the website. This screenshot illustrates the specific filter titled, “Employment trends by tenure” from 2016 to 2020, and also showcases the Report list on the side with the links available to users.
Maybe you prefer a more traditional way of looking at data. In this case, you can go through the static tables found on our Diversity and inclusion statistics page.
And if you’re more of a data nerd, the best way to look at data is to dive right into the datasets available on Open Government where you can browse additional topics like Health and Safety, Processes and Persons to your heart’s content.
The new Data Visualization Tool aims to help the Government of Canada achieve the best possible representation of Canadian society. We’re very excited about this tool (can you tell?) and about the more complete picture of the public service it gives us!


Add new comment